SkyTrace: A Real-Time Aviation Telemetry Platform
by Ondrej Grünwald, Founder / CEO
Showing a live aircraft on a map looks simple from the outside. A dot moves, the label updates, maybe a trail follows behind it.
The hard part is everything required before that dot can exist in a form that is actually useful.
For SkyTrace, I did not want a consumer flight tracker clone. I wanted an operational surface I could build on: a system that starts at raw ADS-B reception, normalizes and stores events, supports both hot-path and historical queries, and serves a real-time map with enough context to be worth using.
That means more than plotting latitude and longitude. It means dealing with stream transport, retention, replay, metadata lookup, weather overlays, airspace geometry, and two deployment profiles that share the same raw data shape.
This post is the current implementation, not the idealized end state. It is the system as it exists today, what decisions shaped it, and what I would change if I started again.
SkyTrace is not a flight tracker with a feed attached. It is a telemetry platform that happens to end in a map.
The post is really about three connected concerns: how telemetry enters the system, how the platform preserves hot and historical access, and how the UI stays fast enough to work like an operational surface instead of a demo.
1. The Problem Is Not the Dot on the Map
ADS-B itself is not the difficult part. Aircraft broadcast identity, position, altitude, velocity, and related state. If all I needed was a raw feed and a table, the system would be much smaller.
The real problem starts when that signal has to become an operational picture.
For SkyTrace, that operational picture had a few non-negotiable requirements:
- live updates without polling every individual aircraft
- enough backend structure to support replay and trails, not just the current frame
- metadata lookup for selected aircraft
- integration points for weather, airspace, and reference data
- a deployment model that could work both as a full cloud stack and as a lighter edge-style system
That immediately pushes the design away from a single-process app. It becomes a pipeline problem.
The input side is continuous and uneven. Different sources produce different shapes and cadences. Some data is bursty. Some updates arrive incomplete. Some fields need normalization before they can be trusted downstream. Once the signal is in motion, I still need to answer two very different classes of query:
- What is happening right now in the current viewport?
- What happened before, across a longer time range or across more data than the hot store should serve directly?
That is why SkyTrace ended up as a telemetry platform with a map on top, not a map with a data feed behind it.
2. System Overview
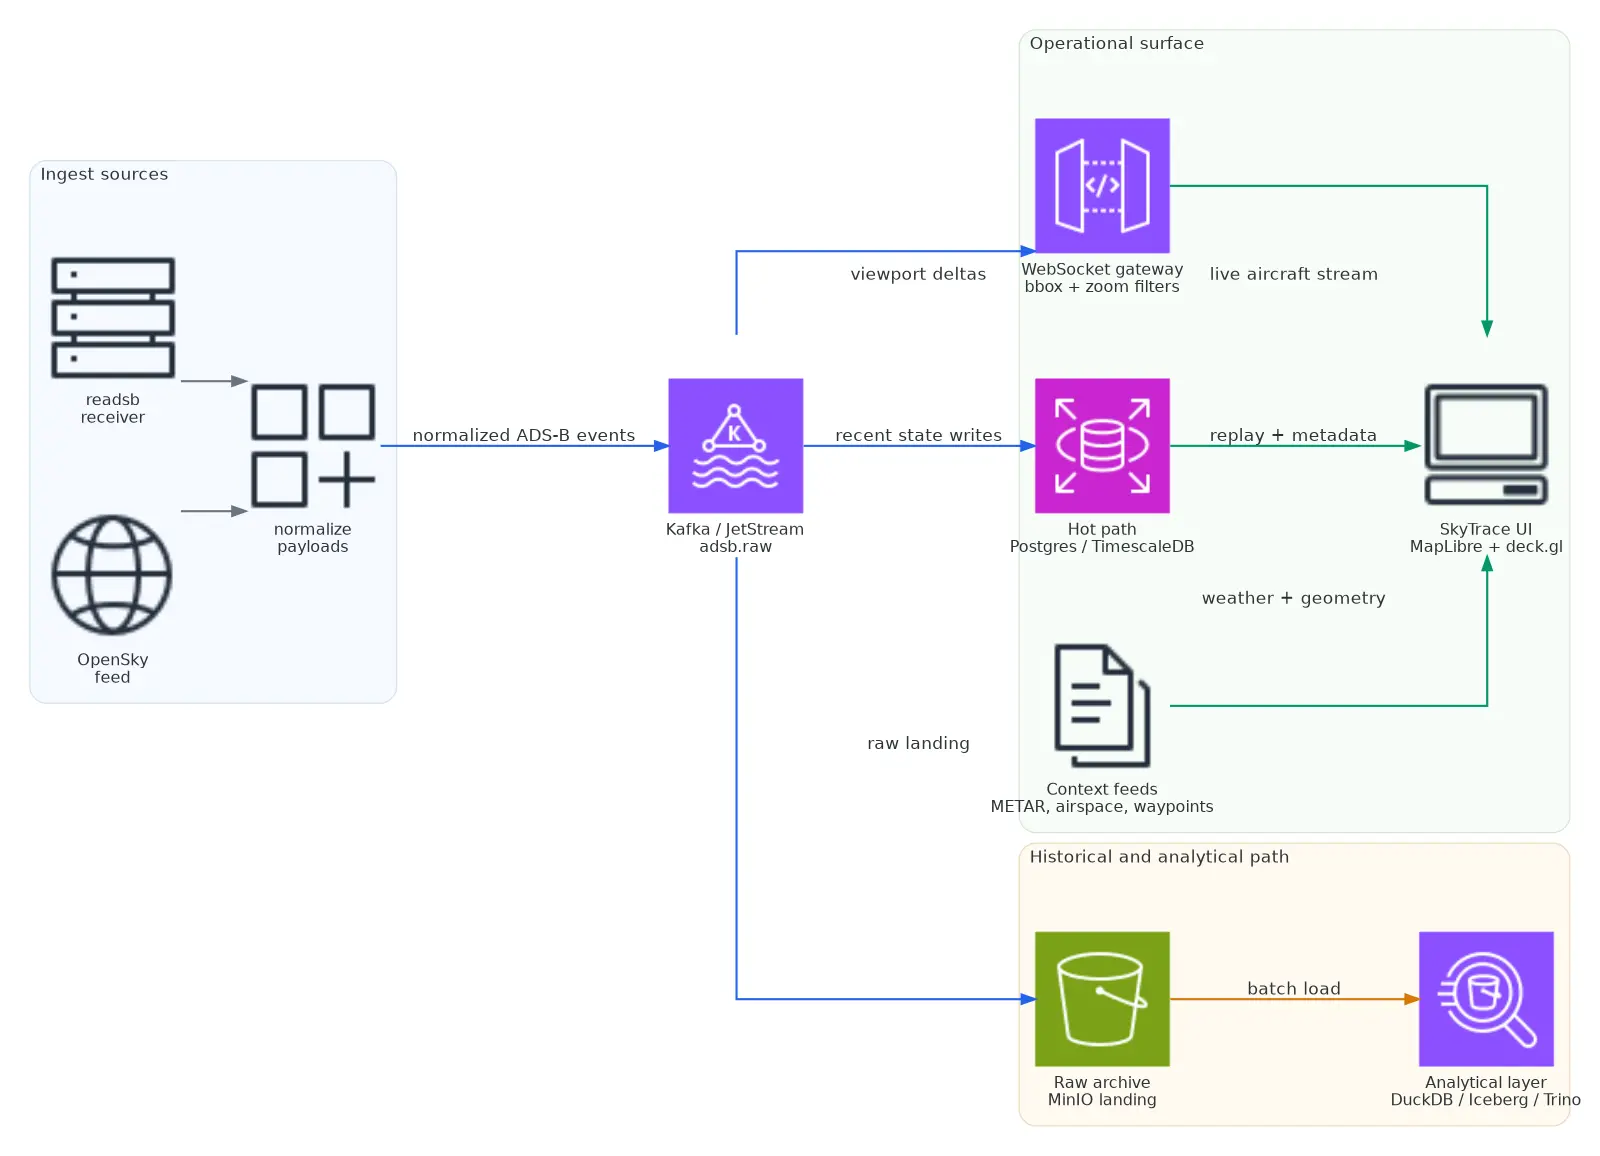
The backbone fans out into three paths: a live operational surface, a hot store for recent and replayable state, and a raw archive that can be loaded back into the analytical layer later.
There are two deployment profiles behind that shape.
Full Stack
The heavier version of the platform, used when richer queryability, operational tooling, and historical depth matter more than footprint.
- Kafka for the event backbone
- MinIO for raw landing
- Iceberg REST plus Trino for analytical tables
- Airflow for scheduled loading and maintenance
- Postgres / TimescaleDB for the hot operational path
Lite Stack
The smaller operating mode, designed to keep the raw landing and hot path intact without dragging the whole warehouse layer everywhere.
- NATS JetStream instead of Kafka
- The same raw MinIO landing pattern
- Postgres / TimescaleDB for hot data
- No Kafka, Trino, or Airflow in the minimum profile
The important design constraint was that the lite path should not produce a fundamentally different data shape. In the current implementation, both full and lite flows land raw messages into MinIO under the same partitioned layout:
topics/<subject>/year=YYYY/month=MM/day=dd/hour=HH/That is what makes it possible to treat the edge-style deployment as a smaller operating mode rather than a separate product.
3. Ingestion and Stream Transport
The ingest side lives in the data-platform repo as async adapters for ADS-B sources such as readsb and OpenSky. Those adapters normalize each message into a consistent dictionary before publishing it to the message bus.
Normalized Event Shape
The normalized event carries the fields that matter downstream: source,
icao, timestamp, optional callsign, lat / lon, alt_baro /
alt_geom, gs, track, vs, receiver, and received_at.
That normalization step matters more than it sounds. It is where source-specific weirdness gets absorbed once instead of leaking across the whole platform.
One aircraft update changes shape twice before it reaches the map: once when it becomes a normalized raw event, and again when the gateway compresses it into the live client payload.
Normalized raw event
{
  "source": "readsb",
  "icao": "4ca123",
  "timestamp": 1773663484,
  "received_at": "2026-03-14T12:18:04.284Z",
  "callsign": "RYR82AB",
  "lat": 50.1032,
  "lon": 14.2611,
  "alt_baro": 33000,
  "gs": 436.2,
  "track": 271.4,
  "vs": 0,
  "receiver": "lkpr-rx-01"
}
Compact client payload
{
  "id": "4ca123",
  "lat": 50.1032,
  "lon": 14.2611,
  "hdg": 271.4,
  "alt": 33000,
  "gs": 436.2,
  "vs": 0,
  "t": 1773663484284,
  "callsign": "RYR82AB"
}
The default subject or topic is adsb.raw. In the full stack that is Kafka. In the lite stack that is JetStream. I deliberately kept the payload shape aligned so the rest of the system does not care which backbone delivered the event.
For the live map, the important service is the WebSocket gateway in AirTrafficMap/backend/adsb_stream. It consumes normalized ADS-B messages and emits compact client payloads.
The gateway does not just blindly broadcast everything. Clients can subscribe with a bounding box, zoom level, and server-side filters:
Viewport Subscription
{
  "type": "subscribe",
  "bbox": [14.0, 48.5, 18.8, 51.8],
  "zoom": 8,
  "filters": {
    "sources": ["readsb", "opensky"],
    "minAlt": 2000,
    "maxAlt": 45000
  }
}
That detail is one of the most important decisions in the whole system. The UI should not be forced to receive the world when the operator only cares about the current viewport. The backend already knows enough to reduce the stream before the browser sees it.
The gateway also batches updates into delta snapshots instead of flushing every individual event immediately. In the current implementation the default flush interval is 250 ms. That is a good compromise for this kind of UI:
- low enough to feel live
- high enough to avoid turning every state change into immediate browser work
It also keeps a TTL for aircraft state so stale tracks do not stay on screen forever.
4. The UI Is Only Fast Because the Backend Contract Is Narrow
The SkyTrace frontend lives in AirTrafficMap/frontend and uses:
Rendering Stack
- React + TypeScript + Vite
- MapLibre GL JS
- deck.gl
MapLibre gives me the map. deck.gl gives me the rendering primitives that actually matter at aircraft-count scale: IconLayer, PathLayer, GeoJsonLayer, text layers, and efficient WebGL updates.
Browser Pipeline
The frontend pipeline is intentionally narrow:
- Receive compact snapshots and deltas over WebSocket.
- Merge aircraft state in a Web Worker.
- Build transferable binary buffers for render data.
- Push those buffers into deck.gl layers.
That worker boundary is doing real work for me. The worker stores aircraft state in a Map<string, AircraftState> keyed by ICAO or aircraft ID, normalizes payloads, evicts stale entries, and prepares render buffers off the main thread.
Zoom-Aware Sampling
The current worker also applies zoom-aware sampling only when the visible set gets large. The downsampling threshold is 400 aircraft. Above that point, the sample rate changes with zoom:
if (zoom === null || zoom >= 8) return 1
if (zoom >= 7) return 0.7
if (zoom >= 6) return 0.4
if (zoom >= 5) return 0.2
return 0.1
That rule is simple on purpose. I wanted predictable behavior, not a clever clustering system that would make selection and trails harder to reason about.
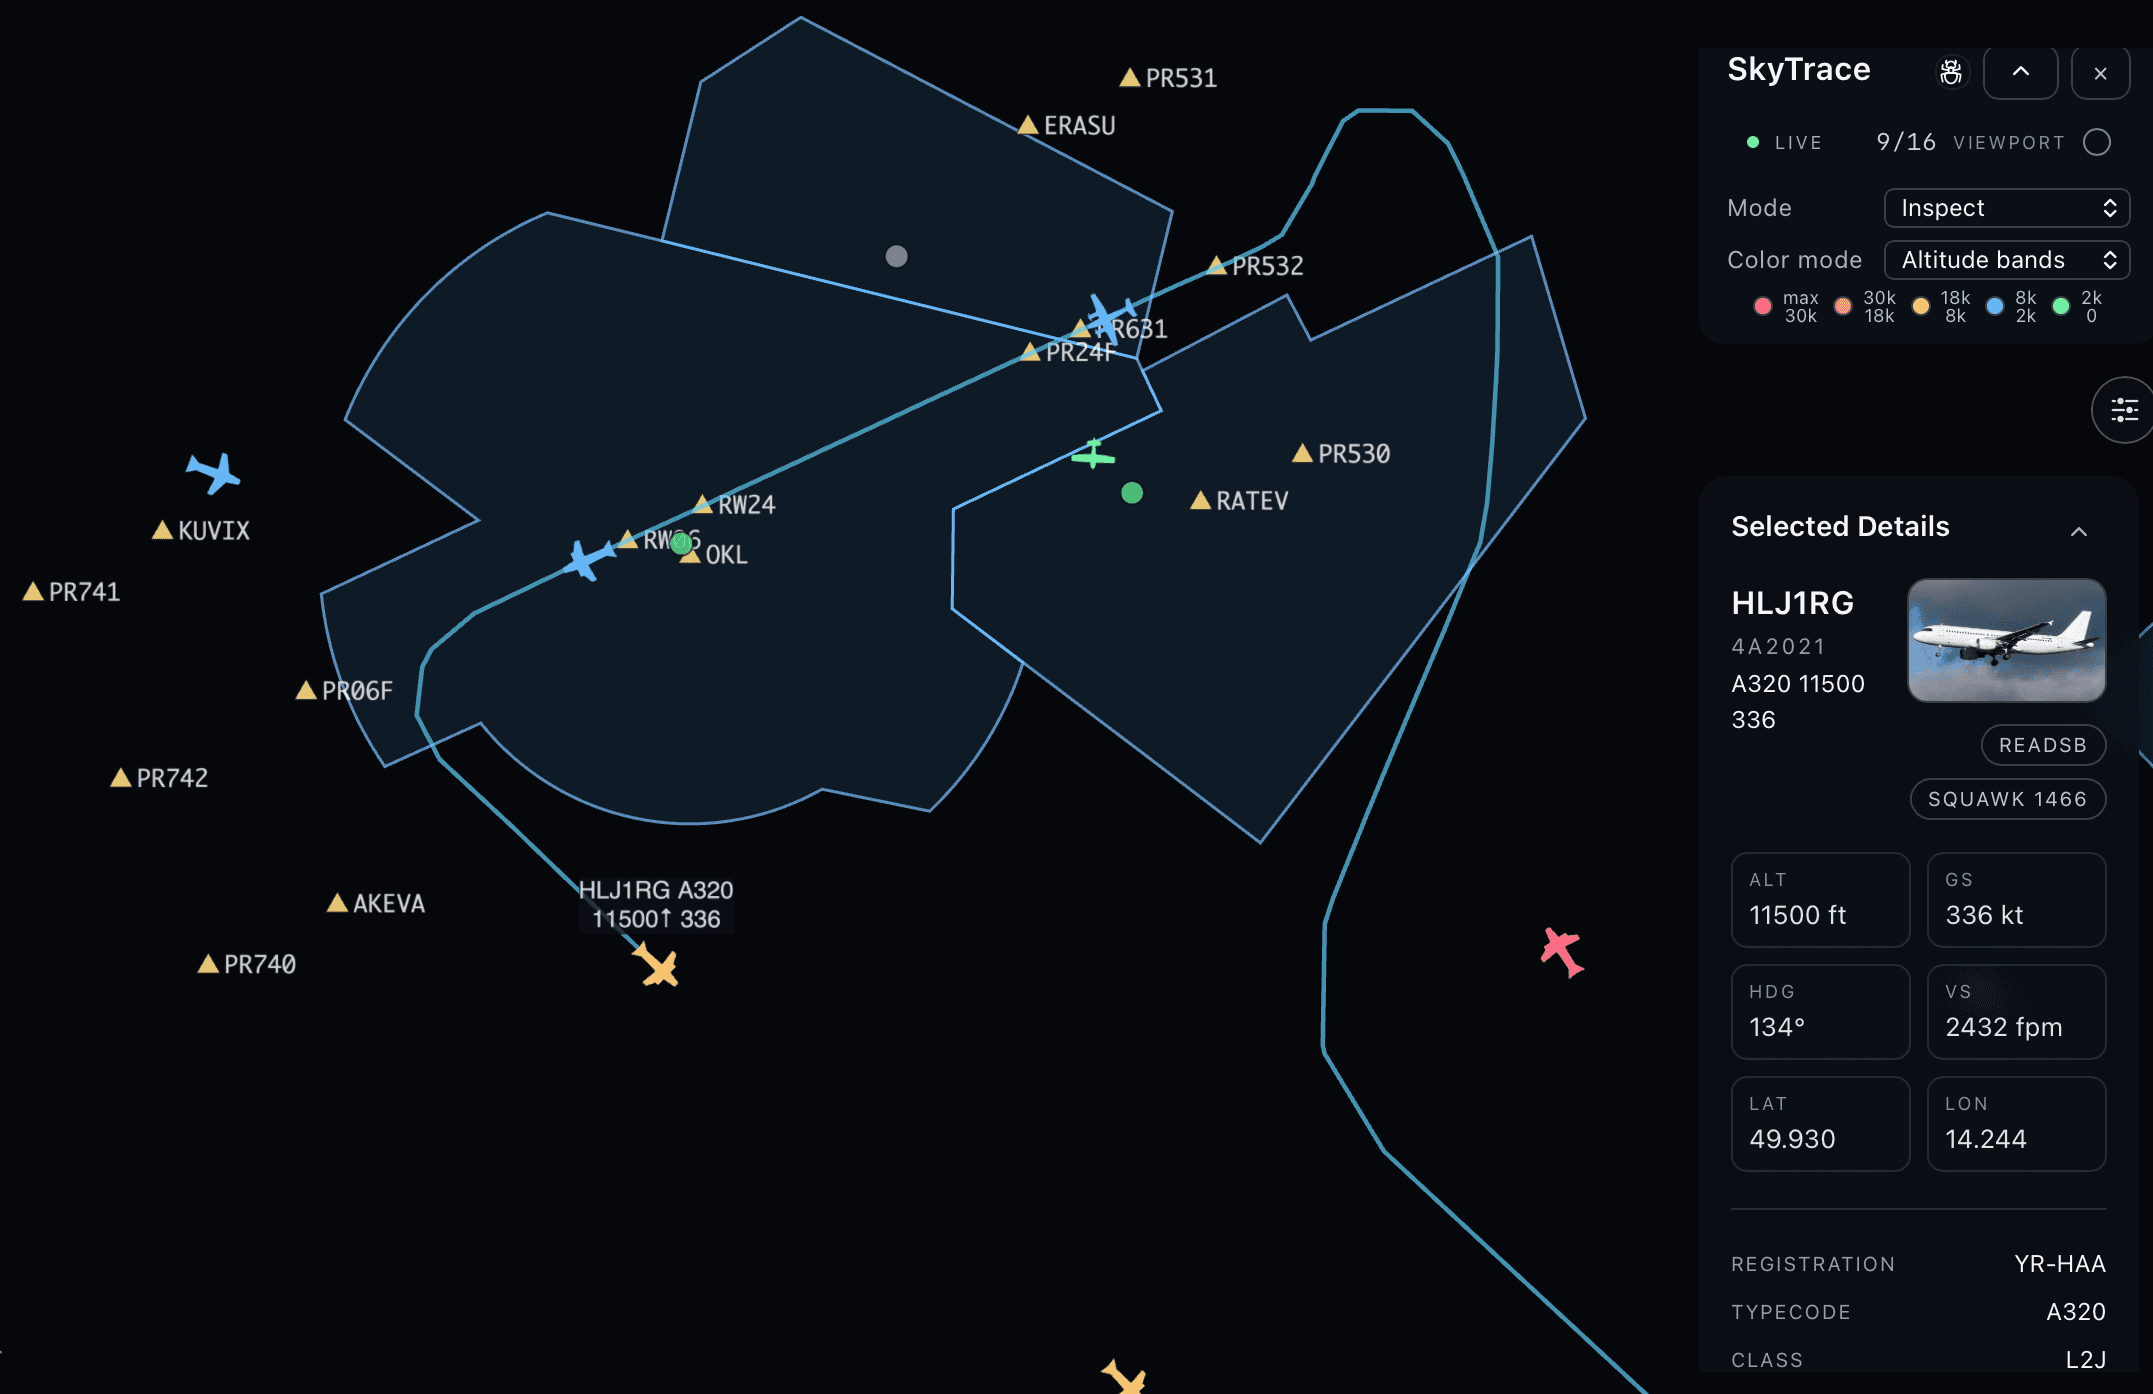
Product Surface
The map itself is not just an icon cloud. The UI now includes:
- selected-aircraft detail panels
- focused trails and sampled history trails
- airspace overlays
- waypoint overlays
- airport and METAR layers
- replay controls backed by historical data
- UI modes for overview, inspect, and analyze
What made this build move quickly was not frontend speed for its own sake. It was that the backend already exposed the right contract.
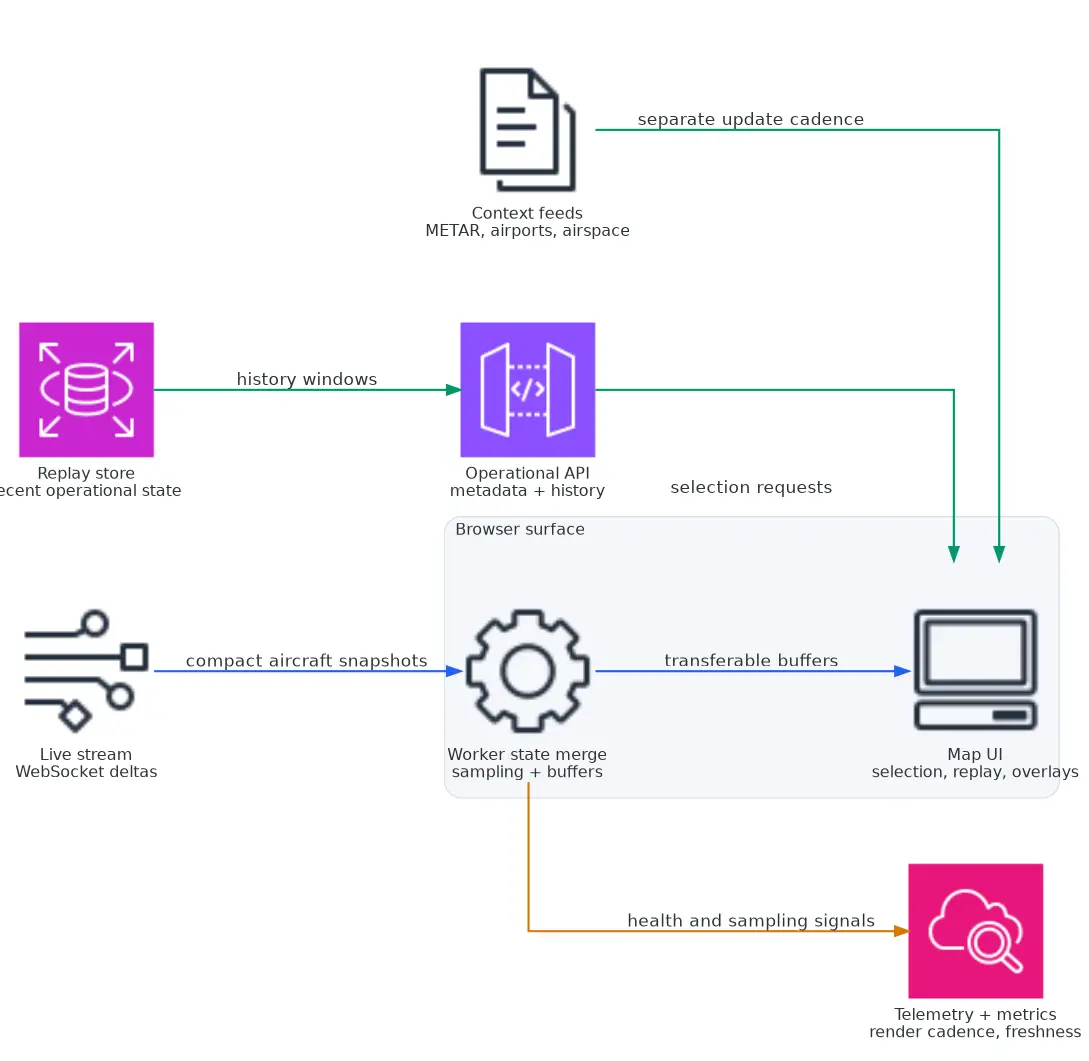
The map surface looks richer than the live payload because it is composed from a few deliberately separate contracts:
- WebSocket deltas for live aircraft state in the active viewport
- metadata lookup for the selected aircraft
- trail history for replay and inspection
- METAR and TAF endpoints for weather context
That split keeps the live stream small while still giving the UI enough context to behave like an operational tool rather than a generic map demo. Once those contracts were stable, the UI became mostly a rendering and interaction problem.
- Live delta flush interval
- 250 ms
- Aircraft state TTL
- 60 s
- Visible aircraft before downsampling
- 400+
- Full cloud and lite edge
- 2 profiles
5. Why I Split the Hot Path from the Analytical Path
One of the more important decisions in the broader platform was not trying to make one storage system solve every query.
The current split is:
- Postgres / TimescaleDB for the hot path
- MinIO + Iceberg + Trino for the analytical path
That split exists because the map and the platform ask for different things.
The hot path wants:
- recent aircraft state
- quick metadata lookups
- replay windows that feel operational
- predictable latency
The analytical path wants:
- broader scans across raw and curated history
- transformation pipelines
- partition-aware backfills
- a place to keep raw data without pretending it belongs in the serving layer
In the data-platform repo, raw data lands in MinIO as gzip JSONL. The DuckDB loader reads those partitions and writes Iceberg tables such as:
aviation_silver.adsb_cleanaviation_gold.adsb_curated
That gives me a useful separation:
- the raw lake is an append-heavy source of truth for loading and reprocessing
- the hot store serves the operational surface
- the Iceberg layer exists for curated and historical analysis
I did not want the map stack waiting on a warehouse query to answer something operational. At the same time, I also did not want to force historical or curation work into the hot serving database.
6. Full Cloud Versus Lite Edge
The full-versus-lite split is one of the more interesting parts of the system because it changes what “production-ready” means.
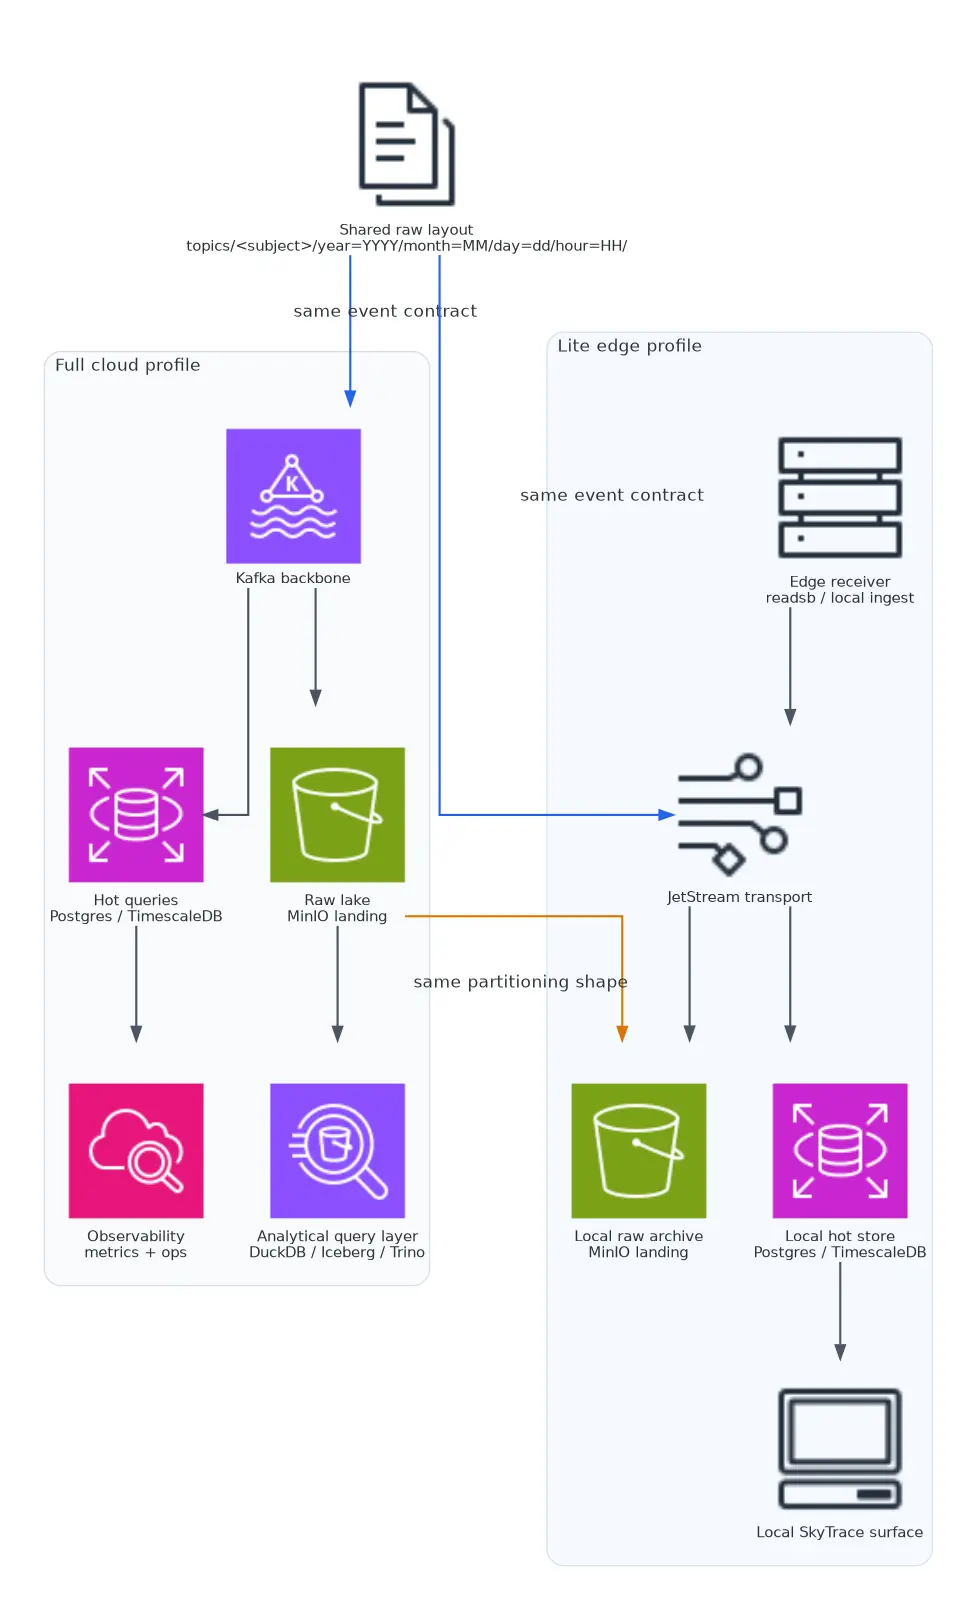
The important part of the comparison is not Kafka versus JetStream.
What matters is that both profiles preserve the same raw landing contract, so the smaller edge mode can still be treated as part of one telemetry platform.
In the full stack, the platform can afford more moving parts:
- Kafka
- Kafka Connect or equivalent raw movement
- Trino
- Iceberg REST
- Airflow
- Grafana
In the lite stack, the priority shifts toward fewer dependencies and a narrower operational footprint. The compose file in data-platform/docker-compose-lite.yaml is a good summary of that philosophy:
services:
  nats:
    image: nats:2.10-alpine
    command: ["-js", "-sd", "/data", "-m", "8222"]

  minio:
    image: minio/minio

  adsb-producer:
    environment:
      MESSAGE_BUS: nats
      NATS_SUBJECT: adsb.raw

  raw-archiver:
    environment:
      MESSAGE_BUS: nats
      MINIO_RAW_BUCKET: lake

  tsdb-consumer:
    environment:
      MESSAGE_BUS: nats
That stack is not glamorous, but it is pragmatic. It preserves the key pieces:
- live event transport
- raw landing to object storage
- hot-path writes to the operational store
What gets left out is the heavy orchestration and warehouse layer.
I think this matters because many real aviation deployments are not born in a perfect cloud environment. Sometimes the right answer is a smaller system that can still preserve raw events and serve the map locally, then backfill into the central lake later.
7. What SkyTrace Is Really Optimizing For
There are a few design choices that show what the system is optimizing for:
Operational View First
The UI avoids turning everything into labels by default. Labels are cheap only when they are sparse, so they stay focused on hovered or selected aircraft rather than becoming permanent clutter.
Narrow Live Payloads
The live payload is compact on purpose. Richness comes from joining live state with metadata, history, and weather through separate endpoints rather than bloating every real-time message.
Replay as a First-Class Mode
Replay is not an afterthought. The backend and frontend both have replay-specific handling, which is the right tradeoff if the map is meant to be inspected rather than only watched live.
Same Raw Shape Across Deployment Profiles
This is the decision that makes the rest of the architecture composable. If full and lite produced different raw structures, the platform would fragment immediately.
8. What I Would Do Differently
A few parts of the system are stronger for having been built. A few are more complicated for having been built incrementally.
If I started again, I would probably change three things.
I Would Separate the Operational Gateway Earlier
Right now the ADS-B stream service has grown into a useful mixed-role component:
- WebSocket gateway
- aircraft metadata API
- history endpoint
- METAR and TAF endpoints
That was a good speed decision early on. It kept the UI moving.
But over time, it also creates coupling between live streaming, historical access, and auxiliary lookup behavior. If I were rebuilding this cleanly, I would separate the transport gateway from the broader operational API earlier.
I Would Choose the Messaging Split More Aggressively
Supporting both Kafka and JetStream is useful because the deployment profiles are genuinely different. But it also expands the operational surface area.
If I had to simplify the system for a cleaner first version, I would either:
- commit to Kafka earlier and accept the heavier minimum footprint, or
- commit to JetStream for the field and small-stack story, then justify Kafka only when the surrounding ecosystem truly needs it
The current dual-path works, but it is a decision that needs discipline.
I Would Be Stricter About UI Surface Area
The map now has modes, filters, replay controls, weather overlays, trails, lists, and diagnostics. That is useful, but it also means the product surface can get wider faster than the operator’s actual task.
I think the right long-term move is to keep the visible UI defaults extremely narrow and let the richer controls appear only when the operator is clearly in inspect or analyze mode.
9. Why I Still Think the Architecture Is Right
Even with those tradeoffs, I still think the overall architecture is the right one for what SkyTrace is trying to be.
The system has a clean enough backbone:
- normalized telemetry events
- event transport instead of point-to-point updates
- an operational store for hot queries
- a raw lake for replay, loading, and analysis
- a frontend that only asks for the information it actually needs
That is the difference between a map demo and a telemetry platform.
SkyTrace is not interesting because it can draw aircraft icons. It is interesting because the same system can:
- ingest live telemetry
- preserve raw history
- serve operational queries
- replay prior state
- expose a usable operator-facing surface
That is the part I wanted to build from the beginning.